CPU
Performance and efficiency cores
System CPU split into user, system, idle, and per-core activity, with P/E labels so you can see where macOS is scheduling work.
CPU, unified memory, GPU, pressure, and fans — read straight off the silicon and drawn in one roomier menu-bar panel. Pick a refresh cadence, inspect P/E core activity, and hover any metric for a plain-English definition.
Free · Apple Silicon required · macOS 13+ · v0.4.0 · Signed & notarized
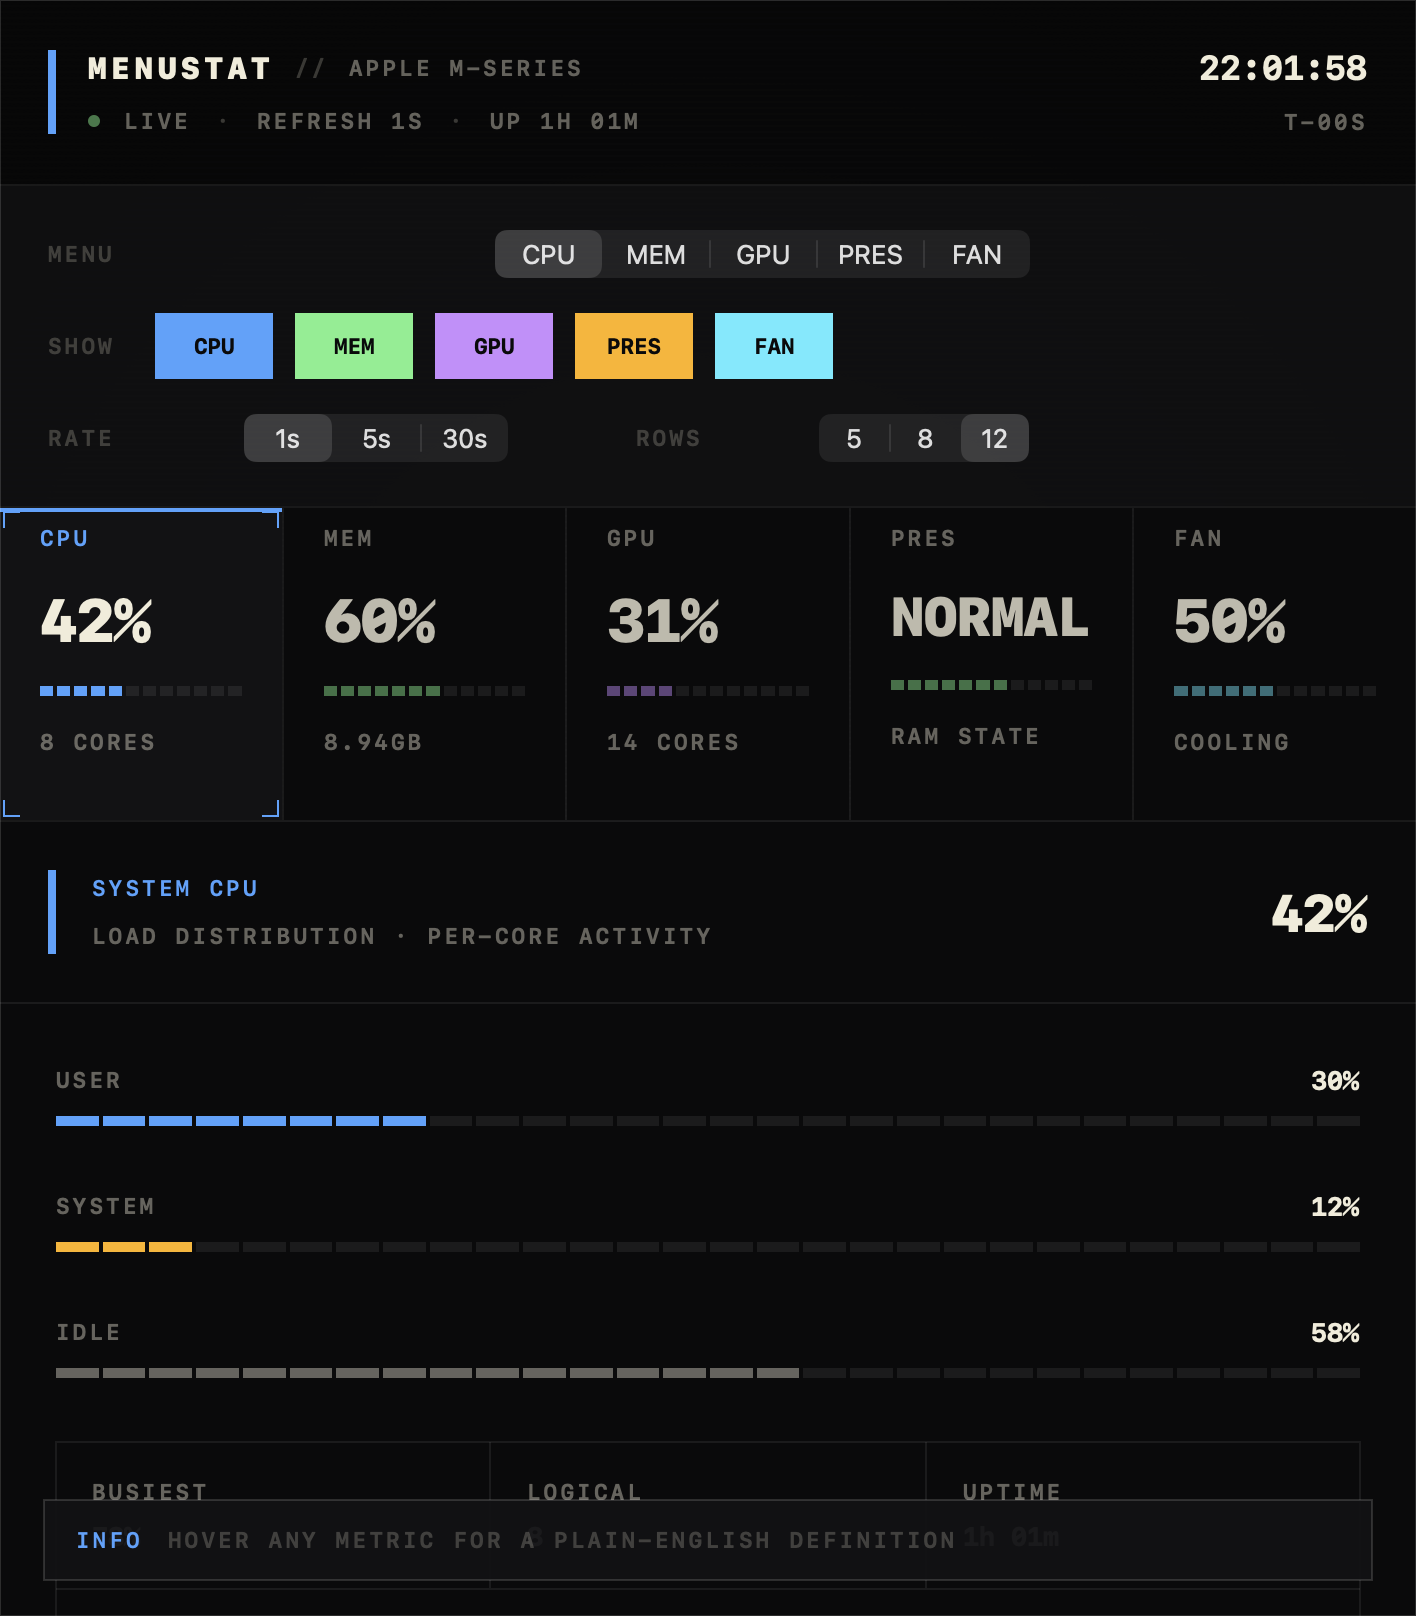
The whole machine, color-coded the way the app shows it. Choose the sections you care about, then open any metric for the full breakdown underneath.
System CPU split into user, system, idle, and per-core activity, with P/E labels so you can see where macOS is scheduling work.
Used, active, wired, and compressed pages broken out — and a live ranking of what is holding the most RAM.
Live device activity read from the AGX accelerator so you can see the graphics cost of what you are running.
Normal, moderate, or high — with hover definitions and a heat-proxy list of likely culprits when memory starts to strain.
Per-fan RPM read straight from AppleSMC, normalized to a range with a quiet / cooling / high status bucket.
Numbers come from Mach, libproc, and IOKit — not a polling shell-out. The UI only ever sees immutable snapshots, so what you read is exactly what the kernel reported.
MenuStat runs as an LSUIElement — no dock icon, no window, nothing to manage. Sampling runs on a serial queue and skips overlapping ticks so it stays light.
Pick a 1s cadence while debugging, 5s for balanced monitoring, or 30s for quiet residency. Heavier per-app sampling only runs while the panel is open.
One small download. It lives quietly up top and tells you exactly what your Apple Silicon Mac is doing, the moment you ask.
v0.4.0 · Apple Silicon required · Intel Macs show an unsupported alert · macOS 13+ · Developer ID signed & notarized